GSoC/2020/StatusReports/DilsonGuimaraes: Difference between revisions
Dilsonguim (talk | contribs) |
Dilsonguim (talk | contribs) |
||
| (15 intermediate revisions by the same user not shown) | |||
| Line 3: | Line 3: | ||
'''Project name:''' Better Graph Layout for the Graph Theory IDE | '''Project name:''' Better Graph Layout for the Graph Theory IDE | ||
Rocs (https://kde.org/applications/education/rocs) is a Graph Theory IDE for experimenting with graphs and graph algorithms in a visual way. It is very useful for teachers, students and researchers. Teachers and students can use Rocs to follow the execution of graph algorithms step by step, with visual indications in the graph itself. Researchers can use Rocs to explore graphs easily and experiment with new algorithms and concepts. | |||
The goal of this project is to improve graph visualization in Rocs, providing graph layout algorithms capable of drawing graphs automatically. This will enable users to explore graphs and graph algorithms more easily, improving their experience. | |||
== Work Report == | == Work Report == | ||
=== Added features === | === Added features === | ||
I created a tool to apply layout algorithms to graphs in Rocs. | I created a tool to apply layout algorithms to graphs in Rocs, named graph-layout plugin. It allows the user to select an algorithm and apply it to a graph. Algorithm specific parameters can also be selected. In total, three algorithms were implemented: Force-Based Layout, Radial Tree Layout and Layered DAG Layout. | ||
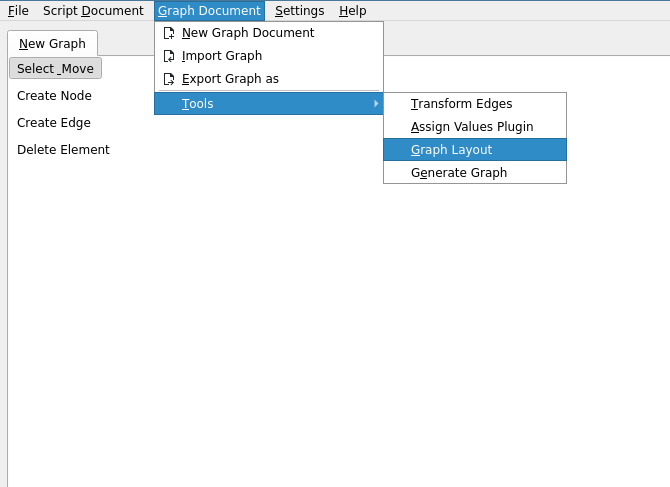
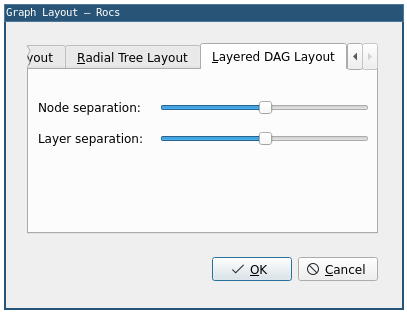
The graph-layout plugin user interface can be found at Graph Document -> Tools -> Graph Layout. There is a separate tab for each one of the layout algorithms available. In each one of these tabs the parameters of the corresponding layout algorithm can be selected. | |||
[[File:Graph-layout-plugin-menu.png.png]] | |||
Functional tests were written for each layout algorithm, checking the behavior of the algorithm in some simple cases. Non-functional tests were written to evaluate performance of each algorithm in terms of layout quality. | |||
Documentation is provided both in the source code level and in the application level. In the source code, the public interface of the class that generates the layouts is documented in details. Other parts of the code also include comments describing each function and some implementation decisions. In the application level, a description of how to use each one of the available layout algorithms is provided. | |||
==== Force-Based Layout ==== | |||
The Force-Based Layout algorithm was implemented in the first phase of the project. It is the simplest and the most general algorithm from the ones considered in this project. It can be applied to any graph, but no guarantees are given about the resulting layout. In practice, it can generate reasonable results for some graphs. | |||
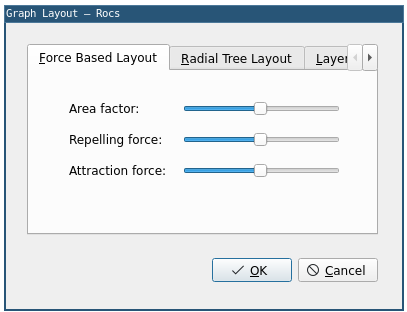
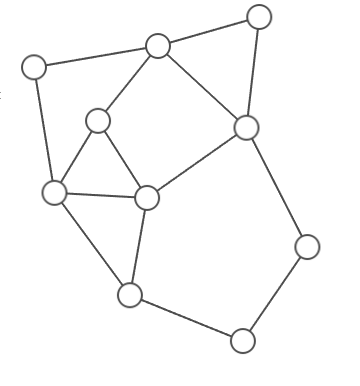
A screenshot of the corresponding tab in the graph-layout plugin user interface follows, as well as some example layouts generated by the Force-Based Layout algorithm. | |||
[[File:Force-based-layout-ui-screenshot.png|Tab corresponding to the Force-Based Layout in the graph-layout plugin user interface.]] | |||
[[File:2020-06-17-planar.png|Layout generated by the Force-Based Layout Algorithm.]] | |||
==== Radial Tree Layout ==== | |||
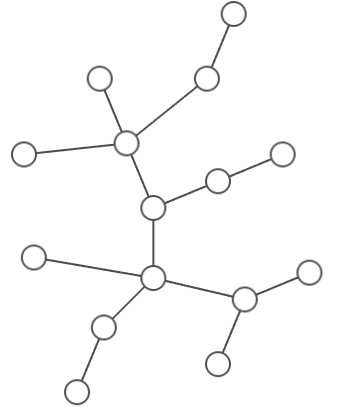
The Radial Tree Layout algorithm was implemented during the second phase of the project. It deals only with trees. Because of the restricted input graphs, this algorithm provides some desirable guarantees. | |||
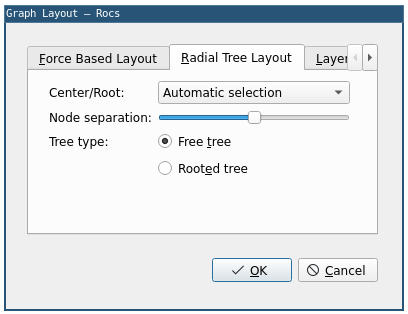
A screenshot of the corresponding tab in the graph-layout plugin user interface follows, as well as some example layouts generated by the Radial Tree Layout algorithm. | |||
[[File:Radial-tree-layout-ui-screenshot.png|Tab corresponding to the Radial Tree Layout in the graph-layout plugin user interface.]] | |||
[[File:2020-07-20-random.png|Layout generated by the Radial Tree Layout Algorithm.]] | |||
==== Layered DAG Layout ==== | |||
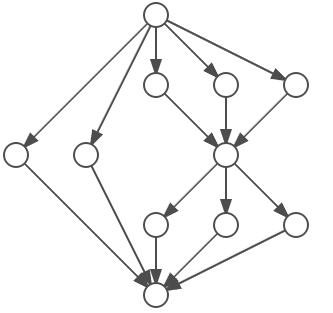
The Layered DAG Layout algorithm was implemented during the third phase of the project. It deals only with directed acyclic graph. The problem of laying out directed acyclic graphs is no easier than the problem of laying out a general graph, because any graph can be transformed into a directed acyclic graph by properly orienting its edges. Besides, directed acyclic graphs layouts usually requires all the edges to point to similar directions. | |||
A screenshot of the corresponding tab in the graph-layout plugin user interface follows, as well as some example layouts generated by the Layered DAG Layout algorithm. | |||
[[File:Layered-dag-layout-ui-screenshot.png|Tab corresponding to the Layered DAG Layout in the graph-layout plugin user interface.]] | |||
[[File:2020-08-20-dag.png|Layout generated by the Layered DAG Layout Algorithm.]] | |||
=== Quality Benchmark === | |||
Given two layouts of the same graph, different individuals can prefer different layouts. | |||
That is, quality if a subjective aspect of a graph layout. | |||
However, there are some aesthetic metrics that can be measured in an objective way. | |||
The number of edge crosses is an example. | |||
Fewer edge crosses does not necessarily mean a better graph layout. | |||
However, in most cases, it is desirable to keep the number of edge crosses small. | |||
The Quality Benchmark is a set of non-functional tests created to evaluate the performance of the graph layout algorithms in Rocs with respect to objective aesthetic metrics. This evaluation occurs in three phases: graph generation, layout computation and layout evaluation. In the graph generation phase, a set of graphs are generated at random from a predefined probability distribution. In the layout computation phase, one of the Rocs graph layout algorithms is applied to the graphs generated in the previous phase. Finally, in the layout evaluation phases, objective aesthetic metrics are computed for each one of the layouts generated in the previous phase. A simple text report is generated containing the minimum, maximum and average of each metric. | |||
Different types of graphs can be generated. Currently, simple, trees, paths, circles and directed acyclic graphs are supported. | |||
The Quality Benchmark is designed to facilitate the inclusion of new metrics. The ones available currently are: | |||
number of edge crosses, number of edges that have at least one cross, number of pairs of nodes that intersect and number of nodes that intersect at least one other node. | |||
The creation of the Quality Benchmark speeded up the process of tuning the parameters of the layout algorithms considerably. | |||
The Quality Benchmark enabled the automatic evaluation of a set of parameter values, making it possible to discard bad candidate values quickly. | |||
In this way, only the promising sets of parameter values to be manually tested. | |||
The Quality Benchmark can also help to identify where future efforts will be better placed. | |||
For instance, it showed that the Force-Based Layout algorithm can generate edge crosses even when applied to trees, | |||
which justifies the implementation of the Radial Tree Layout algorithm. | |||
=== | === What is Next? === | ||
Possible future improvements to Rocs graph visualization capabilities: | |||
* | * Allow edges to be drawn as curves other than straight lines. Bézier curves are a natural choice to consider. | ||
* | * Make it possible for the user to give hints about how to draw a graph. For instance, a hint can be a subset of the nodes that must be placed on a given circle. This would enable the user to generate custom layouts without having to write a graph layout algorithm from scratch. | ||
* New layout algorithms. There are many layout algorithms that can be added to Rocs. The ones based on the Simulated Annealing technique are specially interesting to implement the user hint mechanism. | |||
The layout algorithms in | * More aesthetic metrics for the Quality Benchmark. The literature on graph layout algorithms in full of interesting aesthetic metrics that can be used in the Quality Benchmark to guide the development of the Rocs graph layout capabilities. | ||
=== Commits === | |||
All my commits can the found in the following merge requests. | |||
[https://invent.kde.org/education/rocs/-/merge_requests/24 Graph-layout plugin, with force-based layout and radial tree layout.] | |||
[https://invent.kde.org/education/rocs/-/merge_requests/ | [https://invent.kde.org/education/rocs/-/merge_requests/25 Layered directed acyclic graph layout algorithm included in the graph-layout plugin (Work in progress).] | ||
=== Blog === | === Blog === | ||
My blog can be found [https://dilsonguim.github.io/website/ here | My blog can be found [https://dilsonguim.github.io/website/ here]. The links to posts related to this project are given below: | ||
* [https://dilsonguim.github.io/website/kde/gsoc/2020/05/30/gsoc.html Initial post] | * [https://dilsonguim.github.io/website/kde/gsoc/2020/05/30/gsoc.html Initial post] | ||
| Line 54: | Line 114: | ||
I had to learn about graph layout algorithms to implement this project. I always have fun when I learn new algorithms. This time was not different. Two of the three layout algorithms I implemented are completely heuristic. The only way to get an intuition about the results that they can achieve is by experimentation. Although I love when there is a mathematical proof that the result of an algorithm is good, there are many important situations in which the best thing that can be done is to write a heuristic solution and test it a lot. This is why I value the experience I had working on them. | I had to learn about graph layout algorithms to implement this project. I always have fun when I learn new algorithms. This time was not different. Two of the three layout algorithms I implemented are completely heuristic. The only way to get an intuition about the results that they can achieve is by experimentation. Although I love when there is a mathematical proof that the result of an algorithm is good, there are many important situations in which the best thing that can be done is to write a heuristic solution and test it a lot. This is why I value the experience I had working on them. | ||
== About Me == | |||
'''Name:''' Dilson Almeida Guimarães | |||
'''E-mail:''' [email protected] | |||
'''KDE Invent ID:''' https://invent.kde.org/dilsonguim | |||
'''Blog:''' https://dilsonguim.github.io/website/kde/gsoc/2020/05/30/gsoc.html | |||
'''Mentors:''' Caio Henrique Segawa Tonetti, Adriaan de Groot | |||
Latest revision as of 15:40, 30 August 2020
Project Overview
Project name: Better Graph Layout for the Graph Theory IDE
Rocs (https://kde.org/applications/education/rocs) is a Graph Theory IDE for experimenting with graphs and graph algorithms in a visual way. It is very useful for teachers, students and researchers. Teachers and students can use Rocs to follow the execution of graph algorithms step by step, with visual indications in the graph itself. Researchers can use Rocs to explore graphs easily and experiment with new algorithms and concepts.
The goal of this project is to improve graph visualization in Rocs, providing graph layout algorithms capable of drawing graphs automatically. This will enable users to explore graphs and graph algorithms more easily, improving their experience.
Work Report
Added features
I created a tool to apply layout algorithms to graphs in Rocs, named graph-layout plugin. It allows the user to select an algorithm and apply it to a graph. Algorithm specific parameters can also be selected. In total, three algorithms were implemented: Force-Based Layout, Radial Tree Layout and Layered DAG Layout.
The graph-layout plugin user interface can be found at Graph Document -> Tools -> Graph Layout. There is a separate tab for each one of the layout algorithms available. In each one of these tabs the parameters of the corresponding layout algorithm can be selected.
Functional tests were written for each layout algorithm, checking the behavior of the algorithm in some simple cases. Non-functional tests were written to evaluate performance of each algorithm in terms of layout quality.
Documentation is provided both in the source code level and in the application level. In the source code, the public interface of the class that generates the layouts is documented in details. Other parts of the code also include comments describing each function and some implementation decisions. In the application level, a description of how to use each one of the available layout algorithms is provided.
Force-Based Layout
The Force-Based Layout algorithm was implemented in the first phase of the project. It is the simplest and the most general algorithm from the ones considered in this project. It can be applied to any graph, but no guarantees are given about the resulting layout. In practice, it can generate reasonable results for some graphs.
A screenshot of the corresponding tab in the graph-layout plugin user interface follows, as well as some example layouts generated by the Force-Based Layout algorithm.
Radial Tree Layout
The Radial Tree Layout algorithm was implemented during the second phase of the project. It deals only with trees. Because of the restricted input graphs, this algorithm provides some desirable guarantees.
A screenshot of the corresponding tab in the graph-layout plugin user interface follows, as well as some example layouts generated by the Radial Tree Layout algorithm.
Layered DAG Layout
The Layered DAG Layout algorithm was implemented during the third phase of the project. It deals only with directed acyclic graph. The problem of laying out directed acyclic graphs is no easier than the problem of laying out a general graph, because any graph can be transformed into a directed acyclic graph by properly orienting its edges. Besides, directed acyclic graphs layouts usually requires all the edges to point to similar directions.
A screenshot of the corresponding tab in the graph-layout plugin user interface follows, as well as some example layouts generated by the Layered DAG Layout algorithm.
Quality Benchmark
Given two layouts of the same graph, different individuals can prefer different layouts. That is, quality if a subjective aspect of a graph layout. However, there are some aesthetic metrics that can be measured in an objective way. The number of edge crosses is an example. Fewer edge crosses does not necessarily mean a better graph layout. However, in most cases, it is desirable to keep the number of edge crosses small.
The Quality Benchmark is a set of non-functional tests created to evaluate the performance of the graph layout algorithms in Rocs with respect to objective aesthetic metrics. This evaluation occurs in three phases: graph generation, layout computation and layout evaluation. In the graph generation phase, a set of graphs are generated at random from a predefined probability distribution. In the layout computation phase, one of the Rocs graph layout algorithms is applied to the graphs generated in the previous phase. Finally, in the layout evaluation phases, objective aesthetic metrics are computed for each one of the layouts generated in the previous phase. A simple text report is generated containing the minimum, maximum and average of each metric.
Different types of graphs can be generated. Currently, simple, trees, paths, circles and directed acyclic graphs are supported. The Quality Benchmark is designed to facilitate the inclusion of new metrics. The ones available currently are: number of edge crosses, number of edges that have at least one cross, number of pairs of nodes that intersect and number of nodes that intersect at least one other node.
The creation of the Quality Benchmark speeded up the process of tuning the parameters of the layout algorithms considerably. The Quality Benchmark enabled the automatic evaluation of a set of parameter values, making it possible to discard bad candidate values quickly. In this way, only the promising sets of parameter values to be manually tested.
The Quality Benchmark can also help to identify where future efforts will be better placed. For instance, it showed that the Force-Based Layout algorithm can generate edge crosses even when applied to trees, which justifies the implementation of the Radial Tree Layout algorithm.
What is Next?
Possible future improvements to Rocs graph visualization capabilities:
- Allow edges to be drawn as curves other than straight lines. Bézier curves are a natural choice to consider.
- Make it possible for the user to give hints about how to draw a graph. For instance, a hint can be a subset of the nodes that must be placed on a given circle. This would enable the user to generate custom layouts without having to write a graph layout algorithm from scratch.
- New layout algorithms. There are many layout algorithms that can be added to Rocs. The ones based on the Simulated Annealing technique are specially interesting to implement the user hint mechanism.
- More aesthetic metrics for the Quality Benchmark. The literature on graph layout algorithms in full of interesting aesthetic metrics that can be used in the Quality Benchmark to guide the development of the Rocs graph layout capabilities.
Commits
All my commits can the found in the following merge requests.
Graph-layout plugin, with force-based layout and radial tree layout.
Blog
My blog can be found here. The links to posts related to this project are given below:
Experience
I really enjoyed working on this project. Most of my experience writing software is related to research, competitive programming or course projects. This project was a great opportunity for me to work in something different and get more experience working in a code base I did not create, with tools I did not choose. I learned a lot about Qt, which is used a lot in Rocs.
The open source world is something new for me. I already knew and used a lot of open source software, but I never contributed before deciding to apply to GSoC. The efforts of open source communities such as KDE are able to produce great results and it feels nice to become part of something so amazing.
I had to learn about graph layout algorithms to implement this project. I always have fun when I learn new algorithms. This time was not different. Two of the three layout algorithms I implemented are completely heuristic. The only way to get an intuition about the results that they can achieve is by experimentation. Although I love when there is a mathematical proof that the result of an algorithm is good, there are many important situations in which the best thing that can be done is to write a heuristic solution and test it a lot. This is why I value the experience I had working on them.
About Me
Name: Dilson Almeida Guimarães
E-mail: [email protected]
KDE Invent ID: https://invent.kde.org/dilsonguim
Blog: https://dilsonguim.github.io/website/kde/gsoc/2020/05/30/gsoc.html
Mentors: Caio Henrique Segawa Tonetti, Adriaan de Groot

