GSoC/2019/StatusReports/DevanshuAgarwal: Difference between revisions
m (→Screen Shots) |
No edit summary |
||
| Line 5: | Line 5: | ||
== List of Added Features == | == List of Added Features == | ||
I have added the following features for the first evaluation: | I have added the following features for the first evaluation: | ||
* '''TTest | * '''TTest''' | ||
* '''ZTest | **Two-Sample Independent | ||
* '''ANOVA | **Two Sample Paired | ||
**One Sample | |||
* '''ZTest''' | |||
**Two-Sample Independent | |||
**Two Sample Paired | |||
**One Sample | |||
* '''ANOVA''' | |||
**One Way ANOVA | |||
**TWo Way ANOVA | |||
* '''Levene Test:''' To check for the assumption of homogeneity of variance between populations | * '''Levene Test:''' To check for the assumption of homogeneity of variance between populations | ||
* '''Correlation Coefficient''' | |||
**Pearson's R | |||
**Kendall's Tau | |||
**Spearman Rank | |||
**Chi-Square Test for Independence | |||
== Frontend == | |||
Since a major part of the project aims to make the user comfortable while finding statistics, the special attention was given to frontend. The two major components of Frontend are Dock Widgets (Hypothesis Dock and Correlation Coefficient Dock) and Test Views (Hypothesis Test view and Correlation Coefficient Test View). | |||
== | == Dock Widgets == | ||
Dock Widgets provides an interface to the user to select from various options which are required to perform a test. There are two such dock widgets created during the project course (Hypothesis Test Dock and Correlation Coefficient Dock) which appear on the right side of the window according to the test chosen by the user. Some common and important elements in both the dock widgets are listed below with the brief description: | |||
* '''Name:''' It is the name of dock widget. It can be edited by the user. | |||
* | * '''Comment:''' Any comment which the user wants to add for future reference. | ||
* | * '''Data''' | ||
* | ** '''Source:''' Data source type: Spreadsheet and Database. Currently, only spreadsheet is supported. | ||
* | ** '''Spreadsheet:''' This option appears when the "Spreadsheet" is chosen in "Source". It provides the name of the spreadsheet on which the chosen test will be performed. The user can change the spreadsheet chosen. | ||
* User can select | * '''Test''' | ||
* | ** '''Type:''' Type of Test the user wants to perform | ||
** '''Sub-type:''' Subtype of the test chosen from "Type" option. It will be shown only when there are subtypes for the test-type chosen. | |||
** '''Calculate Statistics for Spreadsheet:''' This checkbox is useful whenever the user doesn't have access to the whole data but have a summary of the data like its number of elements, mean of data, standard-deviation or contingency table. Uncheck this checkbox (default: checked) whenever the user wants to perform tests on statistics or the contingency table. On unchecking the box a [[GSoC/2019/StatusReports/DevanshuAgarwal#Statistic_Table|Statistic Table]] will appear. For now, this feature is supported for Two-Sample Independent Z-Test and Chi-Square Test for Independence. | |||
** '''Number of Rows:''' This option is shown when "Calculate Statistics from Spreadsheet" checkbox is unchecked and the user has data in the form of the contingency table. The user can change its default value and dynamically the statistic table will change the number of rows in it. | |||
** '''Number of Columns:''' Similar to "Number of Rows" option for changing the number of columns. | |||
* '''Variable:''' It is visible when "Calculate Statistics from Spreadsheet" is checked. | |||
** '''Independent Var. 1, Independent Var. 2:''' From here, the user can select columns of a spreadsheet on which the test is to be performed. This combo-box only shows columns which are valid with respect to test selected. The labels and number of such combo-box will change automatically according to the columns/options chosen. For example, whenever "Indpenedent Var.1" is intended to contain categorical labels, the label "Independent Var. 2" will get changed to "Dependent Var. 1". | |||
** '''Independent Var. 1 Categorical:''' This checkbox appears when there is a possibility for column selected in Independent Var. 1 to be categorical such that the "Independent Var. 2" can act as the dependent variable. Check this checkbox for such a case. | |||
** '''Recalculate:''' The user should press this push-button after selecting all the preferred options from the dock. After clicking on this button Test View Widget will get populated by results and statistics. This push-button is disabled when no column is selected in at least one of "Independent Vars" combo boxes. | |||
<br> | |||
There are a few more options which are specific to the Test chosen. These are listed below with a very brief description: | |||
* '''Levene's Test:''' The user can perform Levene's test by clicking on it. It is visible for Two-Sample Independent T-Test and One-Way ANOVA. It shows similar behaviour as "Recalculate". | |||
* '''Equal Variance:''' This checkbox should be checked when the user wants the program to assume homogeneity of variance between populations. This assumption can be checked by performing the Levene Test on the data. Hence It will be visible for all the cases when "Levene's Test" button is visible. | |||
* '''Hypothesis''' | |||
** '''Null:''' The user can see the null hypothesis for T-Test and Z-Test. User can't change it directly but can only do so using the "Alternate" hypothesis option. | |||
** '''Alternate''' The user can select alternate hypothesis for T-Test and Z-Test. The changes will be reflected in the "Null" hypothesis dynamically. | |||
** '''μₒ:''' The user can set population mean for One-Sample T-Test and Z-Test. The default value set is 0. | |||
** '''α:''' The user can set significance level for all Hypothesis Tests. The default value set is 0.05. | |||
<br> | |||
Screenshots for dock widgets: | |||
<gallery> | |||
TwoSampleIndependentTTest dock.png| Hypothesis Test Dock (Test: Two-Sample Independent T-Test) | |||
TwoWayAnova dock.png| Hypothesis Test Dock (Test: Two Way ANOVA) | |||
ChiSquareIndependeceTest dock.png| Correlation Coefficient Dock (Test: Chi-Square Test for Independence) | |||
PearsonR dock.png| Correlation Coefficient Dock (Test: Pearson's R) | |||
</gallery> | |||
== | == Test View == | ||
''' Content under this section is yet to be added ''' | |||
<translate><span id="Statistic Table"></span> </translate> | |||
== | == Statistic Table == | ||
''' Content under this section is yet to be added ''' | |||
== Backend == | |||
''' Content under this section is yet to be added ''' | |||
== Demonstrations == | |||
''' Content under this section is yet to be added ''' | |||
== TODO == | == TODO == | ||
* Add more tooltips to Result View | |||
* | * Check for assumptions using various tests (like Levene's Test). | ||
* | * Reimplement above features when data source type is Database. | ||
* | * Integrate various tests in one workbook to show a summary to the user in few clicks. | ||
* | * All other minor TODOs are already written as comments in source code itself. | ||
== Commits == | == Commits == | ||
My Commits: [https://cgit.kde.org/labplot.git/log/?h=gsoc2019_stats&qt=author&q=Devanshu+Agarwal https://cgit.kde.org/labplot.git/log/?h=gsoc2019_stats&qt=author&q=Devanshu+Agarwal] <br> | |||
These commits are reviewed on phabricator by my | These commits are reviewed on phabricator by my mentors Stefan Gerlach and Alexander Semke. <br> | ||
<br> | |||
Review Request: [https://phabricator.kde.org/p/devanshuagarwal/ https://phabricator.kde.org/p/devanshuagarwal/]. | |||
== About Me == | == About Me == | ||
* '''Name:''' Devanshu Agarwal | * '''Name:''' Devanshu Agarwal | ||
* '''Mentors:''' Stefan Gerlach, Alexander Semke | * '''Mentors:''' Stefan Gerlach, Alexander Semke | ||
* '''Email:''' [email protected], [email protected] | * '''Email:''' [email protected], [email protected] | ||
* '''Github Id:''' https://github.com/agdeva8 | * '''Github Id:''' https://github.com/agdeva8 | ||
* '''IRC nickname:''' agdeva8 | * '''IRC nickname:''' agdeva8 | ||
Revision as of 19:52, 20 August 2019
Project Overview
Project Name: Statistical Analysis in Labplot
Purpose: Adding statistically relevant features in labplot.
List of Added Features
I have added the following features for the first evaluation:
- TTest
- Two-Sample Independent
- Two Sample Paired
- One Sample
- ZTest
- Two-Sample Independent
- Two Sample Paired
- One Sample
- ANOVA
- One Way ANOVA
- TWo Way ANOVA
- Levene Test: To check for the assumption of homogeneity of variance between populations
- Correlation Coefficient
- Pearson's R
- Kendall's Tau
- Spearman Rank
- Chi-Square Test for Independence
Frontend
Since a major part of the project aims to make the user comfortable while finding statistics, the special attention was given to frontend. The two major components of Frontend are Dock Widgets (Hypothesis Dock and Correlation Coefficient Dock) and Test Views (Hypothesis Test view and Correlation Coefficient Test View).
Dock Widgets
Dock Widgets provides an interface to the user to select from various options which are required to perform a test. There are two such dock widgets created during the project course (Hypothesis Test Dock and Correlation Coefficient Dock) which appear on the right side of the window according to the test chosen by the user. Some common and important elements in both the dock widgets are listed below with the brief description:
- Name: It is the name of dock widget. It can be edited by the user.
- Comment: Any comment which the user wants to add for future reference.
- Data
- Source: Data source type: Spreadsheet and Database. Currently, only spreadsheet is supported.
- Spreadsheet: This option appears when the "Spreadsheet" is chosen in "Source". It provides the name of the spreadsheet on which the chosen test will be performed. The user can change the spreadsheet chosen.
- Test
- Type: Type of Test the user wants to perform
- Sub-type: Subtype of the test chosen from "Type" option. It will be shown only when there are subtypes for the test-type chosen.
- Calculate Statistics for Spreadsheet: This checkbox is useful whenever the user doesn't have access to the whole data but have a summary of the data like its number of elements, mean of data, standard-deviation or contingency table. Uncheck this checkbox (default: checked) whenever the user wants to perform tests on statistics or the contingency table. On unchecking the box a Statistic Table will appear. For now, this feature is supported for Two-Sample Independent Z-Test and Chi-Square Test for Independence.
- Number of Rows: This option is shown when "Calculate Statistics from Spreadsheet" checkbox is unchecked and the user has data in the form of the contingency table. The user can change its default value and dynamically the statistic table will change the number of rows in it.
- Number of Columns: Similar to "Number of Rows" option for changing the number of columns.
- Variable: It is visible when "Calculate Statistics from Spreadsheet" is checked.
- Independent Var. 1, Independent Var. 2: From here, the user can select columns of a spreadsheet on which the test is to be performed. This combo-box only shows columns which are valid with respect to test selected. The labels and number of such combo-box will change automatically according to the columns/options chosen. For example, whenever "Indpenedent Var.1" is intended to contain categorical labels, the label "Independent Var. 2" will get changed to "Dependent Var. 1".
- Independent Var. 1 Categorical: This checkbox appears when there is a possibility for column selected in Independent Var. 1 to be categorical such that the "Independent Var. 2" can act as the dependent variable. Check this checkbox for such a case.
- Recalculate: The user should press this push-button after selecting all the preferred options from the dock. After clicking on this button Test View Widget will get populated by results and statistics. This push-button is disabled when no column is selected in at least one of "Independent Vars" combo boxes.
There are a few more options which are specific to the Test chosen. These are listed below with a very brief description:
- Levene's Test: The user can perform Levene's test by clicking on it. It is visible for Two-Sample Independent T-Test and One-Way ANOVA. It shows similar behaviour as "Recalculate".
- Equal Variance: This checkbox should be checked when the user wants the program to assume homogeneity of variance between populations. This assumption can be checked by performing the Levene Test on the data. Hence It will be visible for all the cases when "Levene's Test" button is visible.
- Hypothesis
- Null: The user can see the null hypothesis for T-Test and Z-Test. User can't change it directly but can only do so using the "Alternate" hypothesis option.
- Alternate The user can select alternate hypothesis for T-Test and Z-Test. The changes will be reflected in the "Null" hypothesis dynamically.
- μₒ: The user can set population mean for One-Sample T-Test and Z-Test. The default value set is 0.
- α: The user can set significance level for all Hypothesis Tests. The default value set is 0.05.
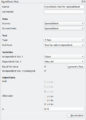
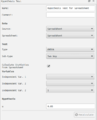
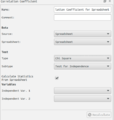
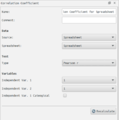
Screenshots for dock widgets:
-
Hypothesis Test Dock (Test: Two-Sample Independent T-Test)
-
Hypothesis Test Dock (Test: Two Way ANOVA)
-
Correlation Coefficient Dock (Test: Chi-Square Test for Independence)
-
Correlation Coefficient Dock (Test: Pearson's R)


Test View
Content under this section is yet to be added
<translate> </translate>
Statistic Table
Content under this section is yet to be added
Backend
Content under this section is yet to be added
Demonstrations
Content under this section is yet to be added
TODO
- Add more tooltips to Result View
- Check for assumptions using various tests (like Levene's Test).
- Reimplement above features when data source type is Database.
- Integrate various tests in one workbook to show a summary to the user in few clicks.
- All other minor TODOs are already written as comments in source code itself.
Commits
My Commits: https://cgit.kde.org/labplot.git/log/?h=gsoc2019_stats&qt=author&q=Devanshu+Agarwal
These commits are reviewed on phabricator by my mentors Stefan Gerlach and Alexander Semke.
Review Request: https://phabricator.kde.org/p/devanshuagarwal/.
About Me
- Name: Devanshu Agarwal
- Mentors: Stefan Gerlach, Alexander Semke
- Email: [email protected], [email protected]
- Github Id: https://github.com/agdeva8
- IRC nickname: agdeva8