Windows/Tools: Difference between revisions
(https://github.com/lucasg/Dependencies) |
|||
| (14 intermediate revisions by 7 users not shown) | |||
| Line 1: | Line 1: | ||
Required or recommended tools for development and using KDE libraries and applications under MS Windows. | Required or recommended tools for development and using KDE libraries and applications under MS Windows. | ||
| Line 7: | Line 8: | ||
[[Image:ProcessExplorer.jpg|thumb|center|Process Explorer]] | [[Image:ProcessExplorer.jpg|thumb|center|Process Explorer]] | ||
== Very Sleepy == | |||
A call profiler for windows; it supports msvc at the moment (it is based on dbghelp.dll) and should give you at least some hints. | |||
[http://www.codersnotes.com/sleepy sleepy] | |||
== Console 2 == | == Console 2 == | ||
''"Console is a Windows console window (cmd.exe) enhancement, useful for using when you depend on this shell, e.g. with msvc. Console features include: multiple tabs, text editor-like text selection, different background types, alpha and color-key transparency, configurable font, different window styles."'' (GPL, for Windows 2000 or newer) [http://sourceforge.net/projects/console more] | ''"Console is a Windows console window (cmd.exe) enhancement, useful for using when you depend on this shell, e.g. with msvc. Console features include: multiple tabs, text editor-like text selection, different background types, alpha and color-key transparency, configurable font, different window styles."'' (GPL, for Windows 2000 or newer) [http://sourceforge.net/projects/console more] | ||
| Line 12: | Line 16: | ||
== Debugging Tools for Windows == | == Debugging Tools for Windows == | ||
You can use ''Debugging Tools for Windows'' package to debug drivers, applications, and services on systems with Windows NT kernel. (freeware) [http://www.microsoft.com/whdc/devtools/debugging/default.mspx more] | You can use programs from ''Debugging Tools for Windows'' package to debug drivers, applications, and services on systems with Windows NT kernel. (freeware) [http://www.microsoft.com/whdc/devtools/debugging/default.mspx more] | ||
Among [http://msdn2.microsoft.com/en-us/library/cc267862.aspx others], ''Debugging Tools for Windows'' do contain: | Among [http://msdn2.microsoft.com/en-us/library/cc267862.aspx others], ''Debugging Tools for Windows'' do contain: | ||
| Line 18: | Line 22: | ||
=== WinDbg === | === WinDbg === | ||
WinDbg (windbg.exe), a user-mode and kernel-mode debugger with a graphical interface. It can also be used to debug user-mode crash dumps (postmortem debugging). | WinDbg (windbg.exe), a user-mode and kernel-mode debugger with a graphical interface. It can also be used to debug user-mode crash dumps (postmortem debugging). | ||
''Note:'' Updated location at [http://msdn.microsoft.com/en-us/windows/hardware/gg454513.aspx] (Standalone Debugging Tools for Windows 8.1 (WinDbg)) | |||
Form [http://www.microsoft.com/whdc/devtools/debugging/debugstart.mspx]: ''"WinDbg provides source-level debugging through a graphical user interface and a text-based interface. WinDbg uses the Microsoft Visual Studio debug symbol formats for source-level debugging. It can access any public function's names and variables exposed by modules that were compiled with Codeview (.pdb) symbol files. | Form [http://www.microsoft.com/whdc/devtools/debugging/debugstart.mspx]: ''"WinDbg provides source-level debugging through a graphical user interface and a text-based interface. WinDbg uses the Microsoft Visual Studio debug symbol formats for source-level debugging. It can access any public function's names and variables exposed by modules that were compiled with Codeview (.pdb) symbol files. | ||
WinDbg can view source code, set breakpoints, view variables (including C++ objects), stack traces, and memory. It includes a command window to issue a wide variety of commands not available through the drop-down menus. [..] It also allows you to remotely debug user-mode code."'', | WinDbg can view source code, set breakpoints, view variables (including C++ objects), stack traces, and memory. It includes a command window to issue a wide variety of commands not available through the drop-down menus. [..] It also allows you to remotely debug user-mode code."'', | ||
To change the postmortem debugger to WinDbg, run windbg -I. (The I must be capitalized.) | |||
Resources related to WinDbg: | Resources related to WinDbg: | ||
* [http://msdn2.microsoft.com/en-us/library/cc266343.aspx Enabling Postmortem Debugging] | |||
* [http://software.rkuster.com/windbg/WinDBG_A_to_Z.pdf WinDbg. From A to Z! ] - Theory and examples (56 pages, 580 Kb) | * [http://software.rkuster.com/windbg/WinDBG_A_to_Z.pdf WinDbg. From A to Z! ] - Theory and examples (56 pages, 580 Kb) | ||
* [http://software.rkuster.com/windbg/printcmd.htm Common WinDbg Commands (Thematically Grouped)] | * [http://software.rkuster.com/windbg/printcmd.htm Common WinDbg Commands (Thematically Grouped)] | ||
| Line 52: | Line 61: | ||
== DebugView == | == DebugView == | ||
Debug messages (logs) generated by kDebug() and kWarning() are not visible on MS Windows unless application is compiled in so-called CONSOLE subsystem. To show these messages also in WINDOWS subsystem, you can use DebugView tool. The tool offers searching in logs, filtering them using wildcards and saving them to file. (freeware) [http:// | Debug messages (logs) generated by kDebug() and kWarning() are not visible on MS Windows unless application is compiled in so-called CONSOLE subsystem. To show these messages also in WINDOWS subsystem, you can use DebugView tool. The tool offers searching in logs, filtering them using wildcards and saving them to file. (freeware) [http://technet.microsoft.com/en-us/sysinternals/bb896647 more] | ||
[[Image:DebugViewWindows.png|thumb|center|DebugView window]] | [[Image:DebugViewWindows.png|thumb|center|DebugView window]] | ||
| Line 58: | Line 67: | ||
A tool for checking dependency of shared libraries. This utility that scans any 32-bit or 64-bit Windows module (exe, dll, ocx, sys, etc.) and builds a hierarchical tree diagram of all dependent modules. (freeware) [http://www.dependencywalker.com/ more] | A tool for checking dependency of shared libraries. This utility that scans any 32-bit or 64-bit Windows module (exe, dll, ocx, sys, etc.) and builds a hierarchical tree diagram of all dependent modules. (freeware) [http://www.dependencywalker.com/ more] | ||
[[Image:DependencyWalkerWindows.png|thumb|center|Dependency Walker window]] | [[Image:DependencyWalkerWindows.png|thumb|center|Dependency Walker window]] | ||
As per https://en.wikipedia.org/wiki/Dependency_Walker there is a new tool called Dependencies.exe https://github.com/lucasg/Dependencies . | |||
== Process Monitor == | == Process Monitor == | ||
Process Monitor is an advanced monitoring tool for Windows that shows real-time file system, Registry and process/thread activity. | Process Monitor is an advanced monitoring tool for Windows that shows real-time file system, Registry and process/thread activity. Use it to discover what process is using given files (very useful knowledge since Windows can block these files). [http://technet.microsoft.com/de-de/sysinternals/bb896645(en-us).aspx more] | ||
[http://technet.microsoft.com/de-de/sysinternals/bb896645(en-us).aspx more] | |||
=== Handle === | |||
Command line program used to find out which program has a particular file or directory open. Handle is a utility that displays information about open handles for any process in the system. [http://technet.microsoft.com/en-us/sysinternals/bb896655.aspx more] | |||
== AutoRuns == | |||
AutoRuns provides very comprehensive knowledge of auto-starting locations, shows what programs are configured to run during system bootup or login, and shows the entries in the order Windows processes them. These programs include ones in your startup folder, Run, RunOnce, and other Registry keys. [http://technet.microsoft.com/en-us/sysinternals/bb963902.aspx more] | |||
== More Diagnostics Tools == | == More System Diagnostics Tools == | ||
[http://msdn2.microsoft.com/en-us/library/aa139733.aspx Debugging and Error Handling, Performance Monitoring, Performance Tools Kit, Error Reporting, Windows Events] | *[http://technet.microsoft.com/en-us/sysinternals/default.aspx Windows Sysinternals: File and Disk Utilities, Networking Utilities, Process Utilities, Security Utilities, System Information, Miscellaneous Utilities] | ||
*[http://msdn2.microsoft.com/en-us/library/aa139733.aspx Debugging and Error Handling, Performance Monitoring, Performance Tools Kit, Error Reporting, Windows Events] | |||
Latest revision as of 02:07, 23 October 2022
Required or recommended tools for development and using KDE libraries and applications under MS Windows.
Process Explorer
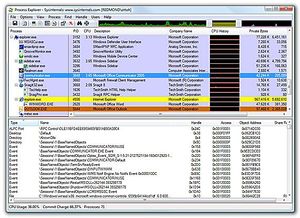
"Ever wondered which program has a particular file or directory open? Now you can find out. Process Explorer shows you information about which handles and DLLs processes have opened or loaded." (freeware, for all Windows versions) more

Very Sleepy
A call profiler for windows; it supports msvc at the moment (it is based on dbghelp.dll) and should give you at least some hints. sleepy
Console 2
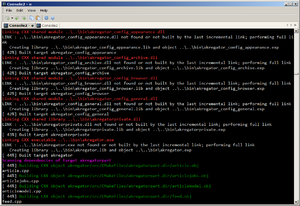
"Console is a Windows console window (cmd.exe) enhancement, useful for using when you depend on this shell, e.g. with msvc. Console features include: multiple tabs, text editor-like text selection, different background types, alpha and color-key transparency, configurable font, different window styles." (GPL, for Windows 2000 or newer) more

Debugging Tools for Windows
You can use programs from Debugging Tools for Windows package to debug drivers, applications, and services on systems with Windows NT kernel. (freeware) more
Among others, Debugging Tools for Windows do contain:
WinDbg
WinDbg (windbg.exe), a user-mode and kernel-mode debugger with a graphical interface. It can also be used to debug user-mode crash dumps (postmortem debugging).
Note: Updated location at [1] (Standalone Debugging Tools for Windows 8.1 (WinDbg))
Form [2]: "WinDbg provides source-level debugging through a graphical user interface and a text-based interface. WinDbg uses the Microsoft Visual Studio debug symbol formats for source-level debugging. It can access any public function's names and variables exposed by modules that were compiled with Codeview (.pdb) symbol files. WinDbg can view source code, set breakpoints, view variables (including C++ objects), stack traces, and memory. It includes a command window to issue a wide variety of commands not available through the drop-down menus. [..] It also allows you to remotely debug user-mode code.",
To change the postmortem debugger to WinDbg, run windbg -I. (The I must be capitalized.)
Resources related to WinDbg:
- Enabling Postmortem Debugging
- WinDbg. From A to Z! - Theory and examples (56 pages, 580 Kb)
- Common WinDbg Commands (Thematically Grouped)
- Tutorial on solving system crashes using WinDbg
Documentation
- "Debugging Tools for Windows" documentation (debugger.chm) (see online version),
CDB
- CDB (cdb.exe), a user-mode debugger with a console interface,
Logger
Logger (logger.exe and logexts.dll), a tool and a plugin DLL that record the function calls and other actions of a program,
LogViewer
LogViewer (logviewer.exe), a tool that displays the logs created by Logger,
GFlags
- GFlags (Global Flags Editor, gflags.exe), a tool used to control registry keys and other settings
The Breakin tool
- The Breakin tool (breakin.exe), a tool used to cause a user-mode break to occur in a process,
The Kill tool
- The Kill tool (kill.exe), a tool used to terminate a process,
UMDH
- UMDH (User-Mode Dump Heap utility, umdh.exe), a tool used to analyze heap allocations
DebugView
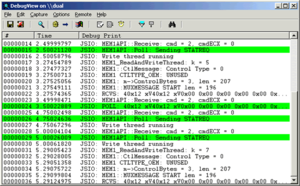
Debug messages (logs) generated by kDebug() and kWarning() are not visible on MS Windows unless application is compiled in so-called CONSOLE subsystem. To show these messages also in WINDOWS subsystem, you can use DebugView tool. The tool offers searching in logs, filtering them using wildcards and saving them to file. (freeware) more

Dependency Walker
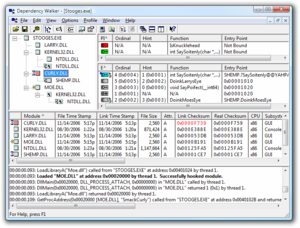
A tool for checking dependency of shared libraries. This utility that scans any 32-bit or 64-bit Windows module (exe, dll, ocx, sys, etc.) and builds a hierarchical tree diagram of all dependent modules. (freeware) more

As per https://en.wikipedia.org/wiki/Dependency_Walker there is a new tool called Dependencies.exe https://github.com/lucasg/Dependencies .
Process Monitor
Process Monitor is an advanced monitoring tool for Windows that shows real-time file system, Registry and process/thread activity. Use it to discover what process is using given files (very useful knowledge since Windows can block these files). more
Handle
Command line program used to find out which program has a particular file or directory open. Handle is a utility that displays information about open handles for any process in the system. more
AutoRuns
AutoRuns provides very comprehensive knowledge of auto-starting locations, shows what programs are configured to run during system bootup or login, and shows the entries in the order Windows processes them. These programs include ones in your startup folder, Run, RunOnce, and other Registry keys. more
