Marble/Sentinel2MapTheme: Difference between revisions
*>B3t0 |
m 109 revisions imported |
||
| (2 intermediate revisions by one other user not shown) | |||
| Line 209: | Line 209: | ||
== Compiling Marble with support for the Sentinel 2 data == | == Compiling Marble with support for the Sentinel 2 data == | ||
Technically marble's | Technically marble's source code since version 16.08 has experimental support for the Sentinel 2 Satellite Map theme built-in already. | ||
In order to enable the vector map theme you need to pass the cmake config option | In order to enable the vector map theme you need to pass the cmake config option | ||
Latest revision as of 08:05, 21 October 2016
Satellite Map Theme based on the Sentinel 2 Mission
Introduction/Motivation
This page is about the process that allows to create a satellite map theme for Marble based on the Sentinel data.
Sentinels Scientific Data Hub
Registering at the SciHub
Go to the Registration website of the SciHub and enter your name, username, password, e-Mail and country. As a domain you can choose "Land" and "Research" for the usage.
Once you press the Register button you will receive an e-Mail which allows you to finalize your registration in the SciHub system by pressing the included link.
As an alternative to creating your own login you can use "guest/guest" as a username/password when logging in.
Looking for data
Go to the SciHub website and press the Login Button to enter it. On the right side you can press the layers button to choose between the Hybrid, Road (OpenStreetMap) and Satellite map (Blue Marble/LandSat) for orientation.
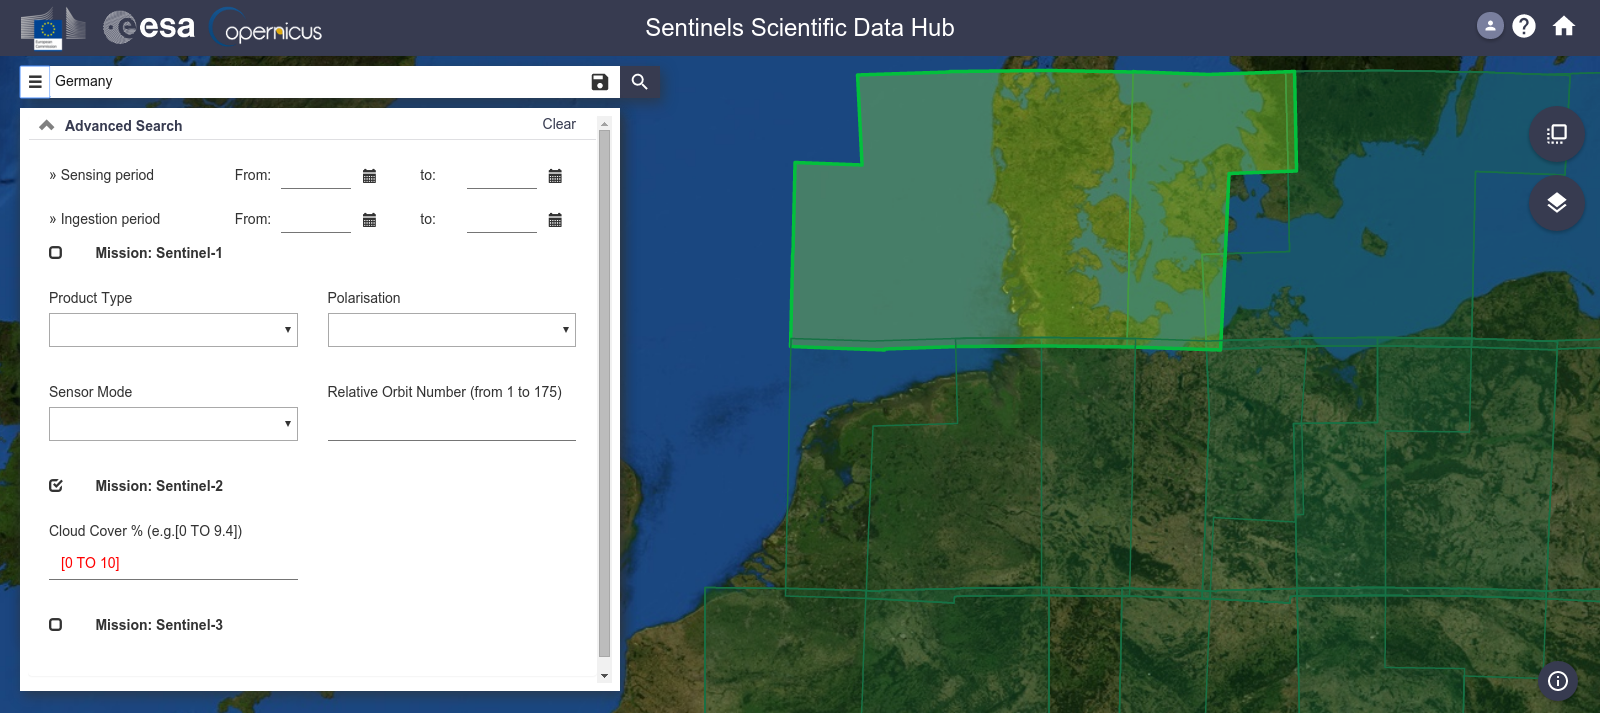
Now we are ready to query some actual Sentinel data. In order to limit our query to useful entries we recommend these adjustments: Press the menu button on the left of the query line edit to enter the Advanced Search
- Check Mission: Sentinel-2
- Enter [0 TO 10] in the cloud coverage Section
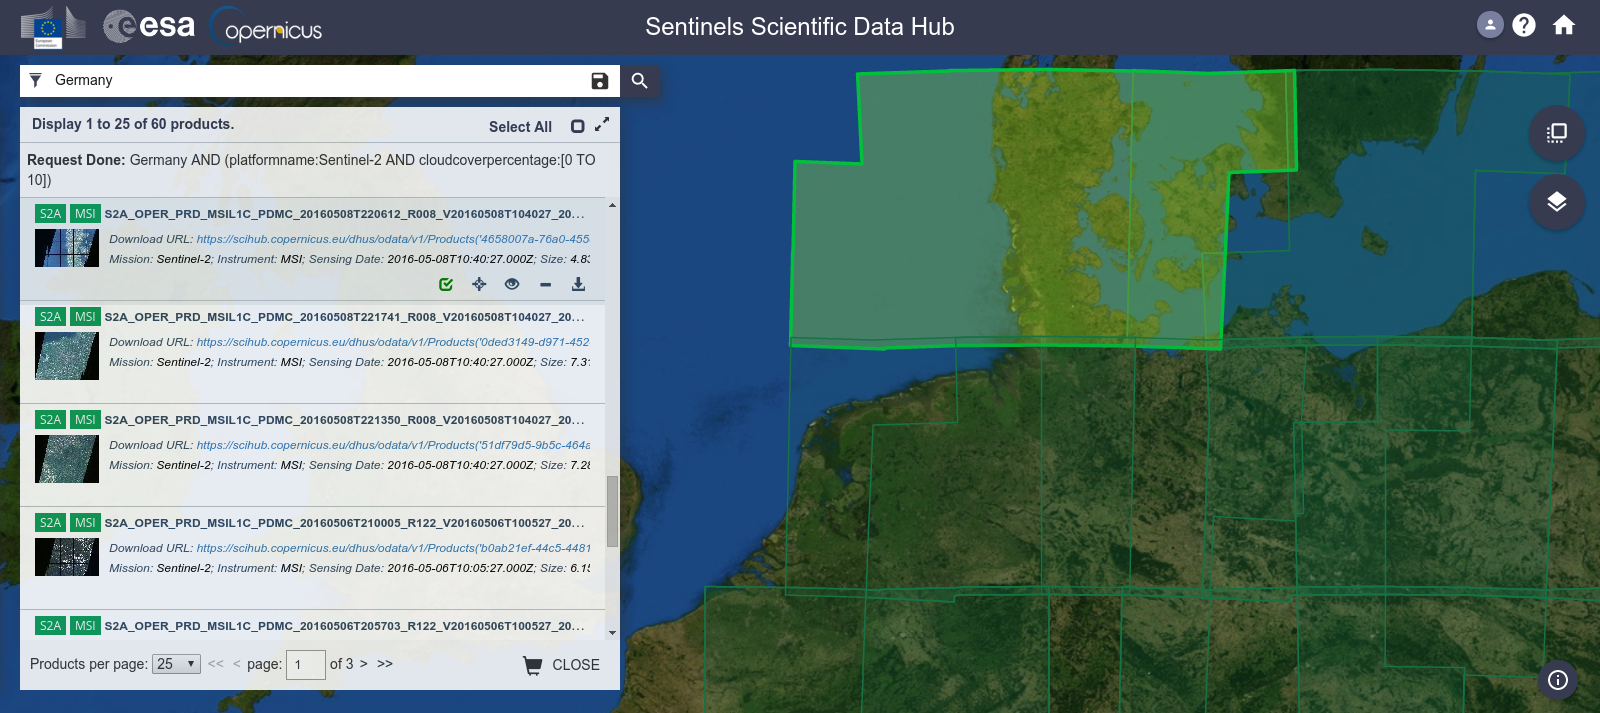
Press the menu button again. The button will turn into a filter icon. Then define the selected region by dragging a rectangle around the area of interest.
You can browse through the pages. The thumb nails give you an idea about the quality of the photographic images. You can press the "eye" button to get an enlarged version of the thumbnail and to get more information.
- images that contain an area that hasn't been included in the map theme yet
- images that ideally have no cloud cover
- images that were taken in bright light.
- images that includes a maximum amount of complete sub tiles (with a minimum of tilted cut off black portions). Eventually only those tiles which are complete (i.e. without clouds and black areas) will be of long-term value.
- images that contain land masses or at least islands or coastlines. We are not interested in Ocean pictures since we will add an artificial ocean later on.
- initially we should rather focus on populated areas in Europe.
- the chosen areas should ideally be adjacent to existing tiles that have been downloaded so that we get "growing" areas.
Once you've made a choice we suggest that you write down:
- the id of the entry (which you can retrieve by pressing the "eye" icon for the entry and copy the id from the title line.
- and the download url
in a text file. Good examples are:
id: S2A_OPER_PRD_MSIL1C_PDMC_20160508T220612_R008_V20160508T104027_20160508T104027 url: https://scihub.copernicus.eu/dhus/odata/v1/Products('4658007a-76a0-455c-bb9a-d9e789b5e1e3')/$value
id: S2A_OPER_PRD_MSIL1C_PDMC_20160508T221741_R008_V20160508T104027_20160508T104027 url: https://scihub.copernicus.eu/dhus/odata/v1/Products('0ded3149-d971-4524-ab80-536ffc1cbb55')/$value
Now click the download link to download the tile. The download will amount to 4-7GB on average. Even if the download gets aborted in the browser it should be possible to continue the download later on. Depending on the connection the download might take a few hours. At times the SciHub server has temporary maintenance down times.
Once the zip file is download unzip it in a directory of your choice. Make sure that your hard disc still has enough space left (approx. 10 GB).
Note: There are also alternative sentinel data browsers available:
1. The Mundialis browser offers a nice search query that also works on smart phones.
2. Once QGIS is installed you could also download further tiles using the SCP plugin, however this approach lacks the nice thumbnails for introspection:
Using QGIS to edit the Sentinel 2 data
QGIS installation
In order to process the data you need to install QGIS. On Ubuntu/Debian you can do this e.g. by opening a terminal and type:
sudo apt-get update
Type in a terminal:
sudo apt-get install qgis
Installing the required plugins
Launch QGIS and enter the Plugins menu. There choose Manage and Install Plugins. Select Not Installed and choose the following plugins for installation in the list:
- QTiles
Also we recommend the following tools:
- Semi-Automatic Classification Plugin
- OpenLayers Plugin
Once you installed the Semi-Automatic Classification Plugin please right-click on the toolbar and enable the SCP toolbar.
Using QGIS to create GeoTiffs for Sentinel-2 subtiles
The current image data is stored in jp2 files which cover one subtile each for a certain spectral band. For each subtile there are about 12 different spectral bands covered. The goal of this chapter is to merge these jp2 files in order to get realistic colors. The end result should be a smaller georeferenced RGB file with realistic colors.
Let's start:
Download the File:Sentinel.zip file and extract it in your home directory. It contains two files: createvrts.py and sentinel-marble.qml. Add the executable flag to the createvrts.py file.
Enter the GRANULE directory inside the .SAFE directory of the unzipped Sentinel-2 data. Then execute the createvrts.py createvrts.py script from inside that directory. It should create a vrts directory inside the GRANULE directory. Inside this directory you should find several .vrt files.
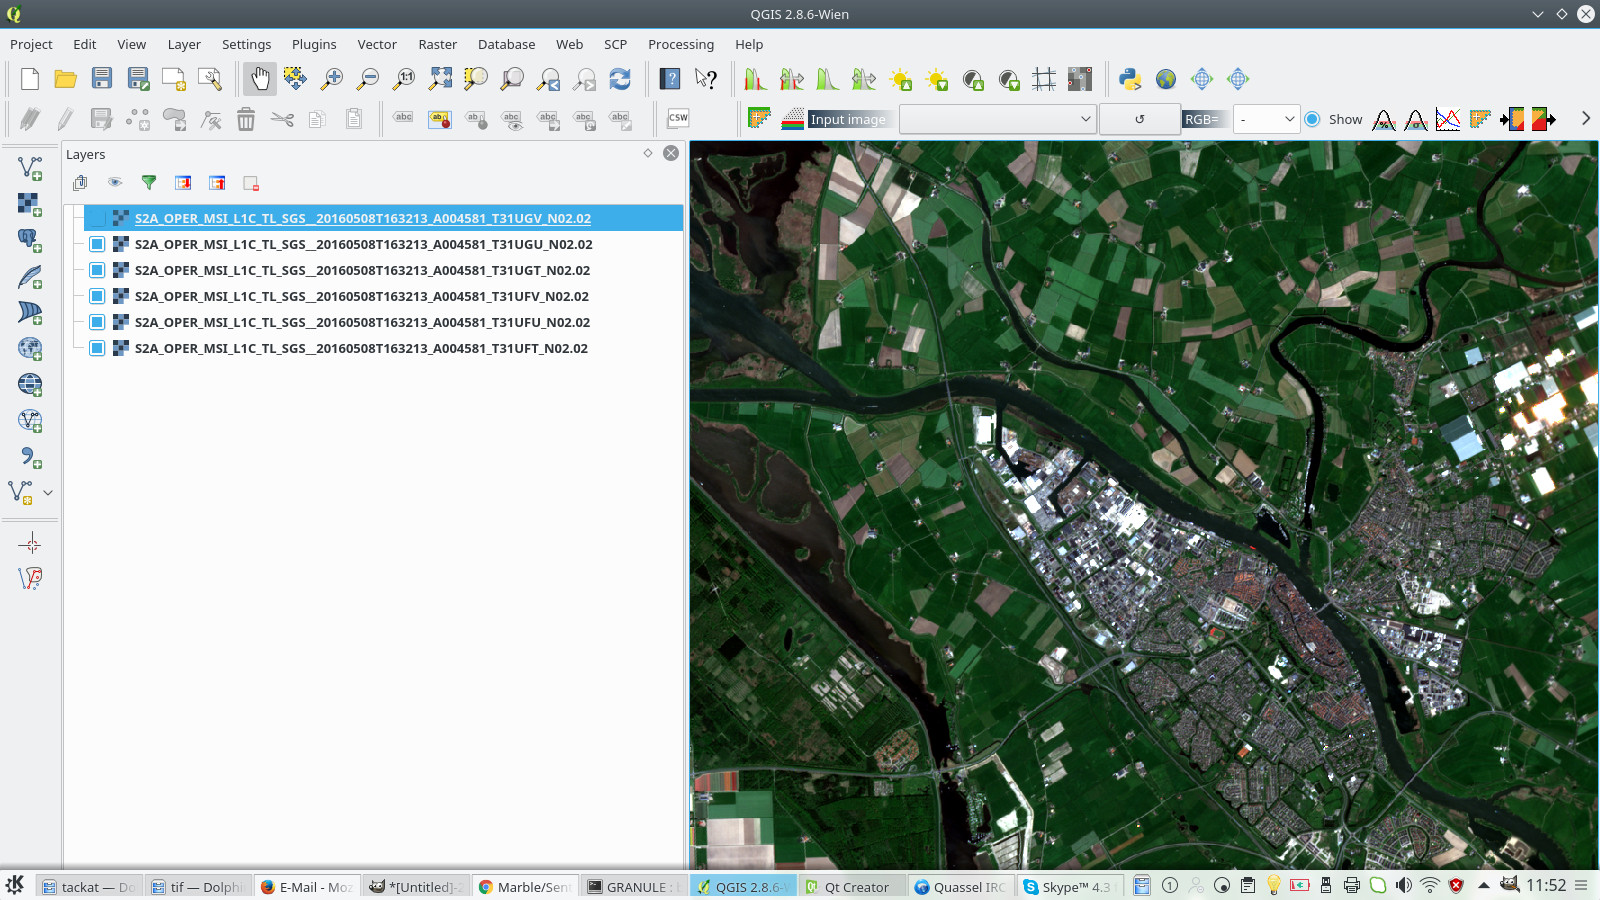
Now launch QGIS. Press Ctrl-Shift-R (or Layer->Add Layer->Add Raster Layer). We'd like to load several .vrt files at once. However loading all would most likely require too much memory. So we have to load them in batches: Using the Ctrl-Key select the first six .vrt files inside the newly created vrts directory. Then press Open.
(In case QGIS crashes on opening the vrt it might be due to a corrupt jp2 file. In that case try to find out which jp2 is the culprit by trying to load the jp2 files into QGIS one by one via the Add Raster Layer feature. Once the corrupted jp2 is identified you can use the following workaround: copy it over by the jp2 with the closest band number. This will unfortunately result in a slightly different color shade).
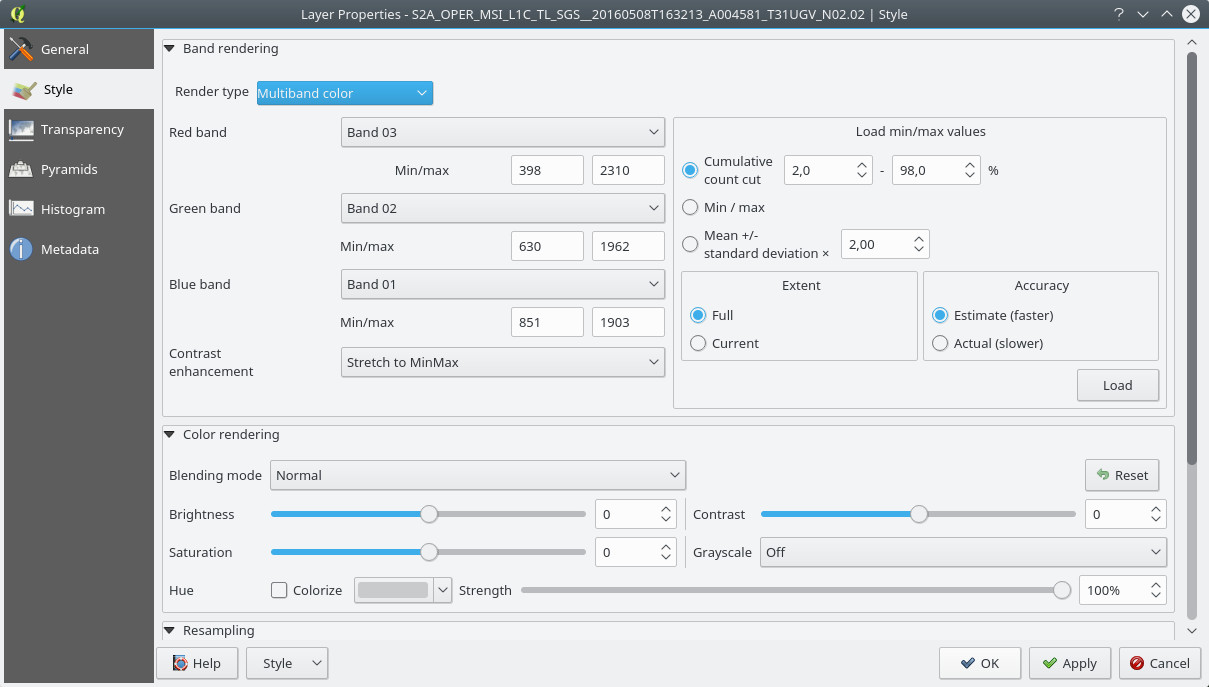
Now we want to apply proper colorization and styling: The styling is stored inside the sentinel-marble.qml file (short for QGIS markup language - so it's NOT a Qt Quick file).
- Right-click on the first (file) entry in the Layers panel.
- Press Properties.
- Press the Style button in the lower left corner
- Press Load Style and load the sentinel-marble-qml file.
- Press Apply. As a result the color of the tile should change to something more vivid.
- Right-click on the first (file) entry in the Layers panel again and choose Styles->Copy Style
- Then right click on all other (file) entries in the Layers panel and choose Styles->Paste Style for each entry.
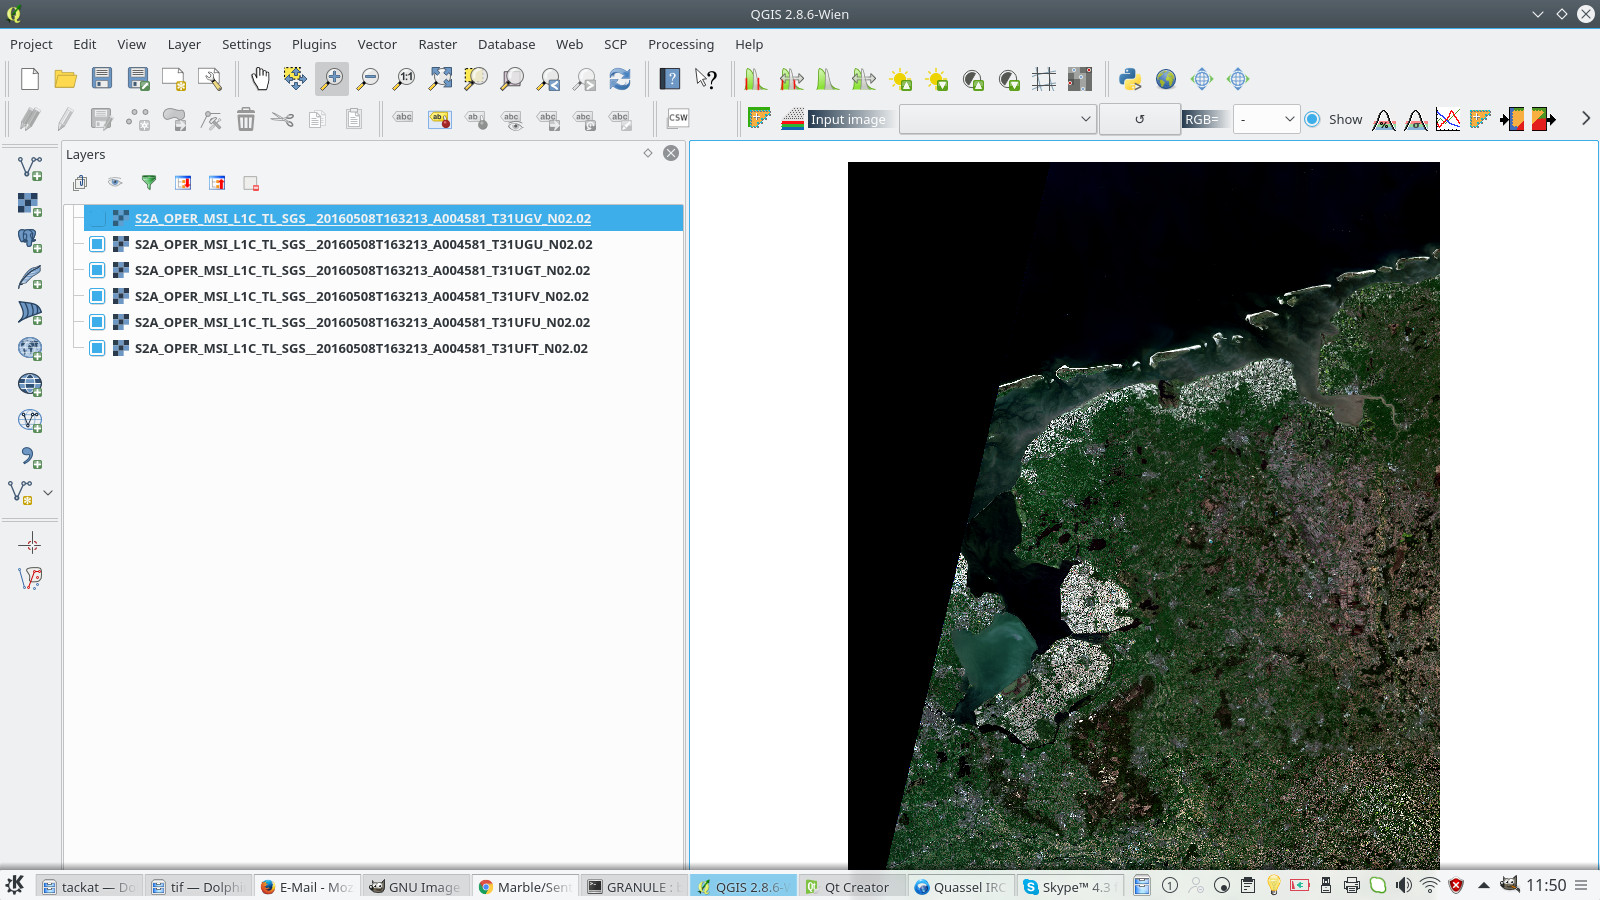
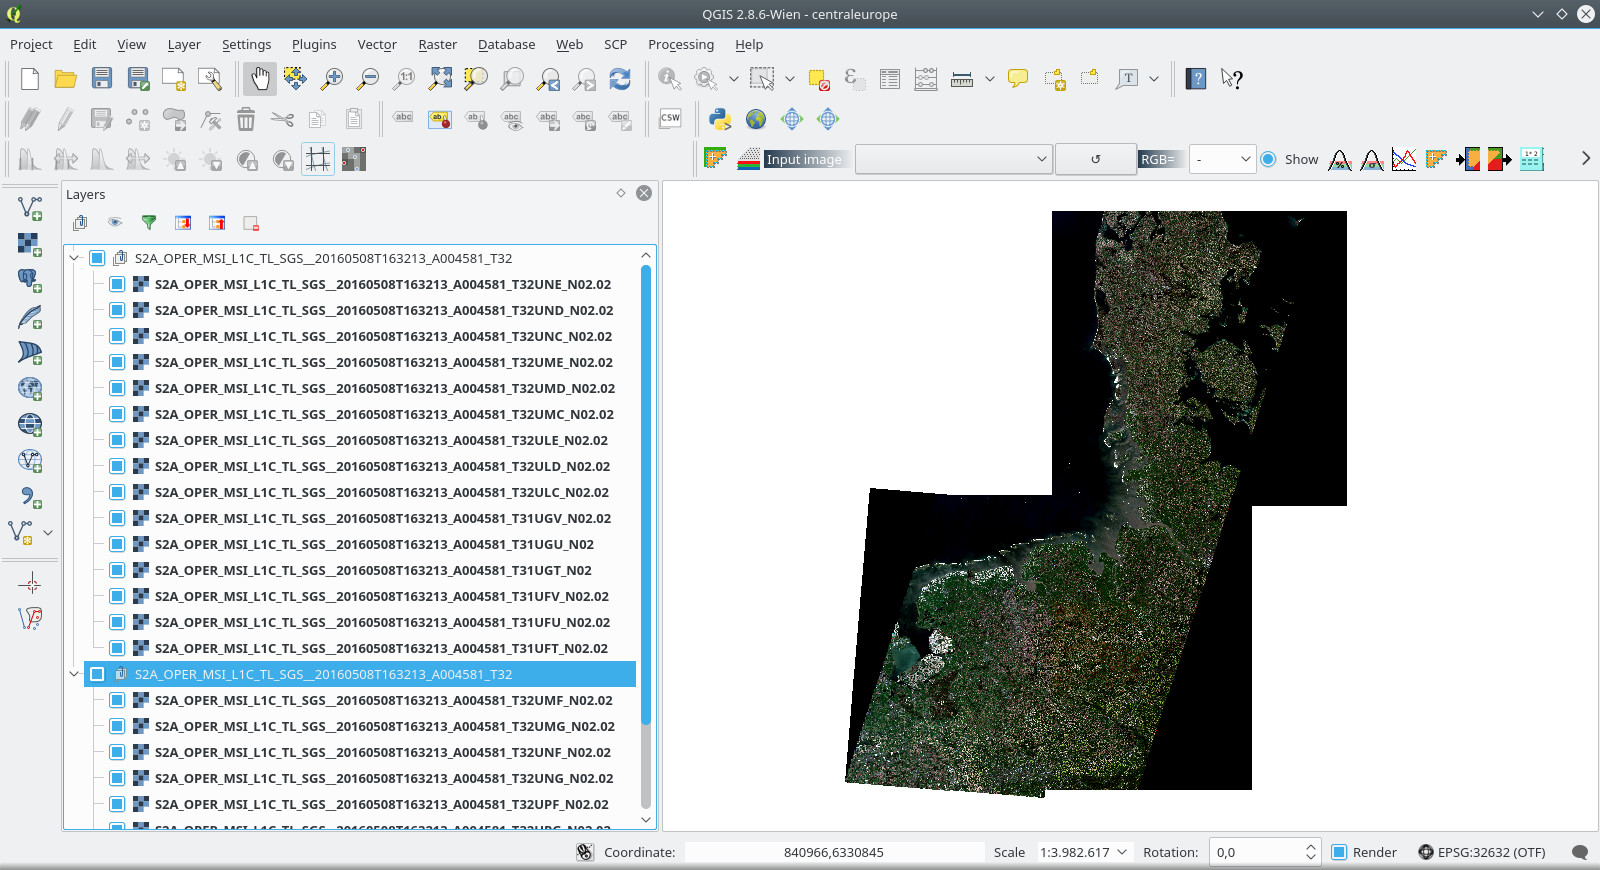
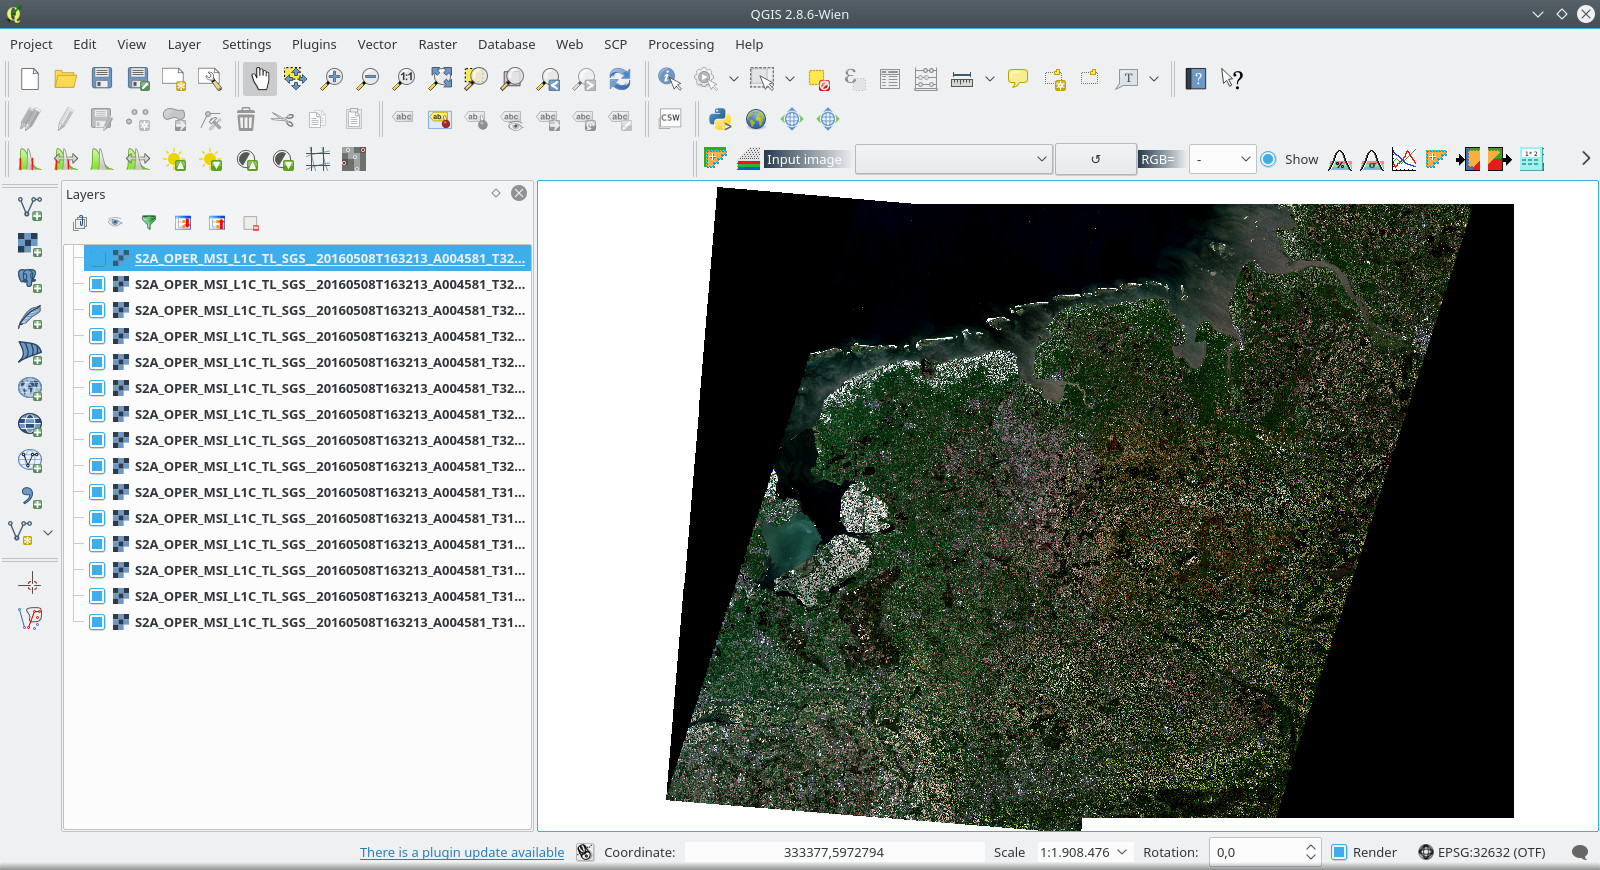
As a temporary result you should see something like this:
Now we want to save the resulting virtual tiles into actual GeoTIFF files:
- Right-click on the first (file) entry in the Layers panel.
- Choose Rename. Then copy the file name using Ctrl-C and press Enter.
- Right-click on the first (file) entry in the Layers panel.
- Choose Save As
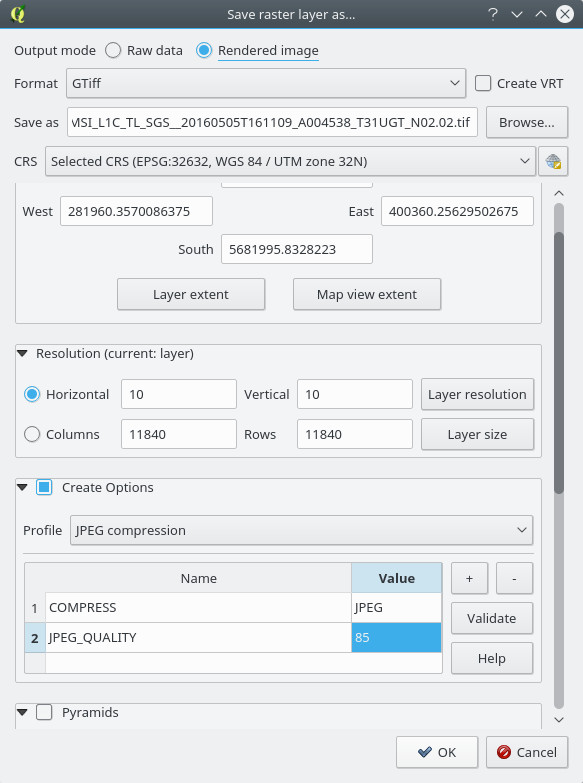
- As an Output mode in the dialog choose Rendered Image.
- Click Browse Button in the Save As field, navigate to the tif directory inside the GRANULE directory. Press Ctrl+V to paste the layer name.
- Enable the Create Options checkbox, choose JPEG Compression as a profile. Change JPEG_QUALITY to 85.
- Press Ok and fetch a cup of coffee while the progressbar goes up to 100%.
- Repeat this procedure for all other entries.
- Alternatively, you may download the File:Geotiff Saver.zip script, and add it to Qgis, by going to the Processing Toolbox (you may open it by pressing Ctrl + Alt + T, if you can't find it, enable it in the Plugins settings) and choosing "Add script from file", under Scripts > Tools.
- Specify a folder to save in, a style file ( sentinel-marble.qml ), and the layers to save and press run. It will automatically go through those layers, add the style and save the tiffs. You may then compress them using the GDAL command below.
The resulting GeoTIFF files will contain the rendered image in RGB representation without storing each band. This is lighter on memory and is better suited for tile processing. As the GeoTIFF files amount to about 75 MB they are also better suited for long-term storage and data exchange than the original jp2 files. (if you forgot to enable the compression profile you can also compress the files using: gdal_translate -co COMPRESS=JPEG -co JPEG_QUALITY=85 inputfile.tif outputfile.tif )
It's important that you keep these GeoTIFF files (e.g. on a USB disk) to allow for recreating the slippy map tiles later on.
Once you are done with creating the first batch of GeoTiffs quit QGIS and restart it. Then repeat the steps in this chapter for the other vrt files until there is a GeoTIFF file for every vrt file.
Later on once you've downloaded more adjacent datasets from the Sentinel SciHub you can combine the GeoTIFF files:
Tile Creation
Press Ctrl-Shift-R (or Layer->Add Layer->Add Raster Layer) and load all GeoTIFFs that you've created so far.
IMPORTANT: Before you start creating the tileset check the properties dialog: Make sure that all GeoTiff subtiles have "Bicubic" and "Average" enabled. This needs to be re-enabled after GeoTIFF generation! Otherwise your tiles will be rendered using the low-quality nearest neighbor resampling approach.
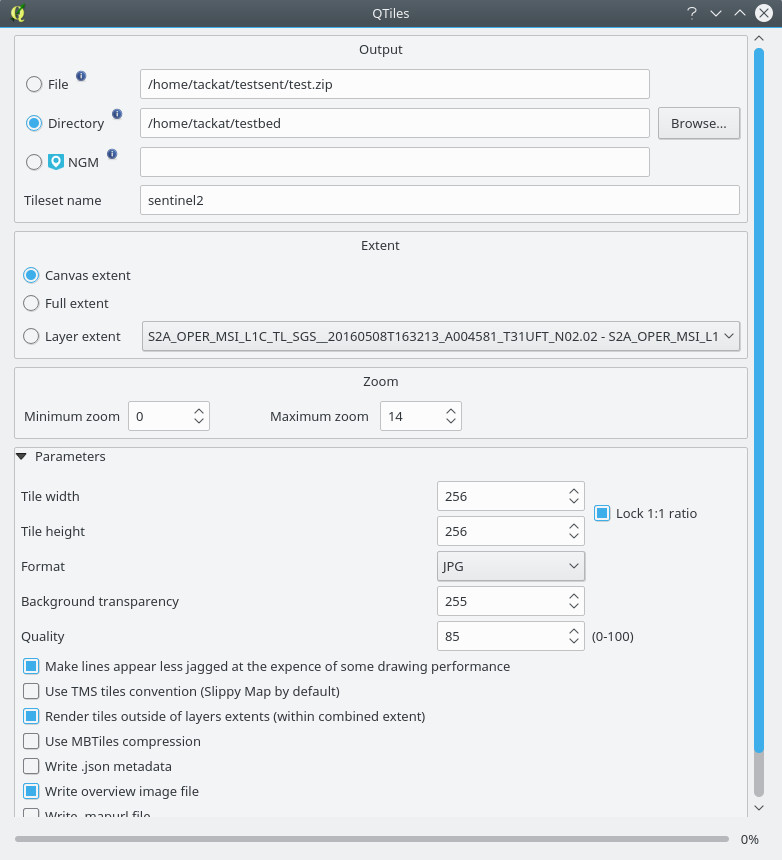
With the new sentinel layer loaded and proper band sets in place we can now start to create our own tiles:
Press Plugins -> QTiles -> QTiles then
- In the Output section choose Directory and browse to your directory of choice where the tiles should be stored
- Enter sentinel2 as a Tileset name
- In the Extent section choose Layer Extent
- In the Zoom section choose 14 as a maximum zoom level
- Choose JPG as a file format
- Choose 85% as the Compression level
- In the Parameters section enable Make lines appear less jagged and Render tiles outside of layers extents (within combined extent).
Questions:
1. Are there any other alternatives to using QTiles? Any better QGIS plugins than this?
Tileset postprocessing
The color range in the sentinel-marble.qml is chosen to allow for wide post processing. The idea is that a complete tile set can be easily batch-processed using image-magick or opencv.
Currently we are using this command inside the sentinel2 directory to apply a better gamma value and saturation to the whole dataset (level 1-14). This requires the graphicsmagick and parallel package to be installed.
find -type f -name "*.jpg" | parallel --progress convert -type TrueColor -gamma 1.33 -modulate 100,110,100 {} {.}.jpg
Since level 14 is at the edge of the highest resolution we apply an additional unsharp mask filter to it:
find -type f -name "*.jpg" | parallel --progress convert -type TrueColor -unsharp 1.75x1.75 {} {.}.jpg
Compiling Marble with support for the Sentinel 2 data
Technically marble's source code since version 16.08 has experimental support for the Sentinel 2 Satellite Map theme built-in already. In order to enable the vector map theme you need to pass the cmake config option
-DEXPERIMENTAL_SENTINEL2_MAP=ON
So in order to compile Marble with vector tile support just compile it as described here:
https://marble.kde.org/sources.php
and just add the config option above, e.g.
cmake -DEXPERIMENTAL_SENTINEL2_MAP=ON ~/marble/sources
You can also enable this option in a more user-friendly way using the cmake-gui application.
Deployment on the server
For deploying the RGBA-GeoTIF-files and the tiles on the server you can mostly follow the access instructions at:
There is one difference: for the tiles we need to use the server darwini instead of depot.
Tiles
For the actual upload of the tiles you can use rsync. From the current local sentinel2 folder you could e.g. call:
rsync -av --progress 13 14 [email protected]:/srv/www/maps.kde.org/earth/sentinel2
to upload level and 13, 14.
RGBA GeoTiff
The RGBA-GeoTIF files are stored inside the sentinel2 directory of the marble user on the KDE server. Before you upload them make sure that the tif files are stored inside a directory named "tif" that is stored in the following directory hierarchy:
S2A_OPER_PRD_MSIL1C_PDMC_20160315T113406_R065_V20150826T102655_20150826T102655.SAFE/GRANULE/tif
Then for uploading you can do:
rsync -av --progress S2A_OPER_PRD_MSIL1C_PDMC_20160315T113406_R065_V20150826T102655_20150826T102655.SAFE [email protected]:~/sentinel2

